While looking for a way to graph the elevation data into a profile, I discovered GPS Visualizer, which not only graphs things like an elevation profile based on the elevation data in the GPS data, but can also use the latitude and longitude information to look up elevation in a DEM (Digital Elevation Model) database and graph that or create a GPX file with the updated elevation information. For me, this basically means I can use GPS Visualizer to convert my KRL files (generated by the Holux) to GPX files with much more accurate elevation data.
Here are some examples.
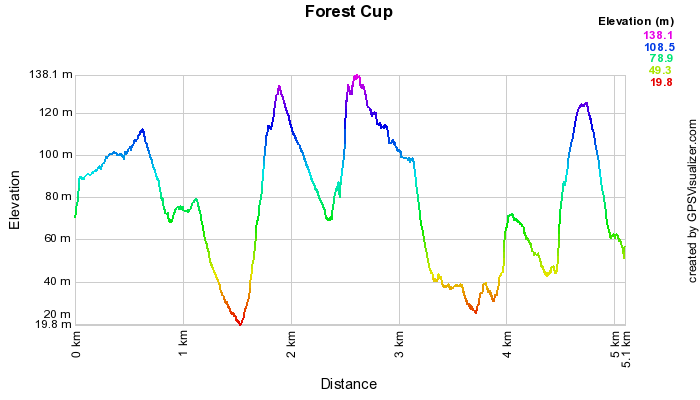
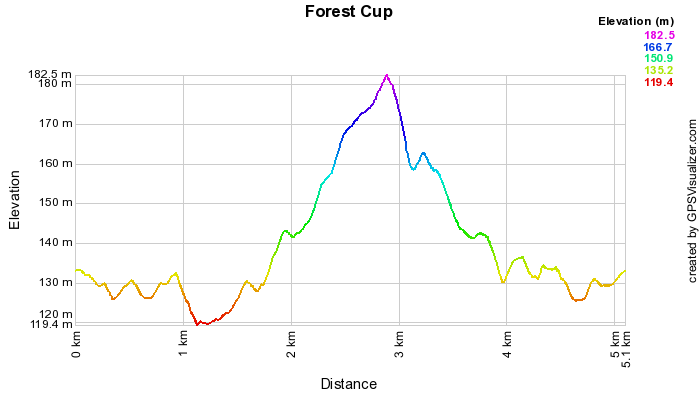
This is a run I do in the office. The first graph is using the elevation data from the Holux and the second using DEM via GPS Visualizer - note that all the graphs below were generated using GPS Visualizer. The first one is so far from accurate.
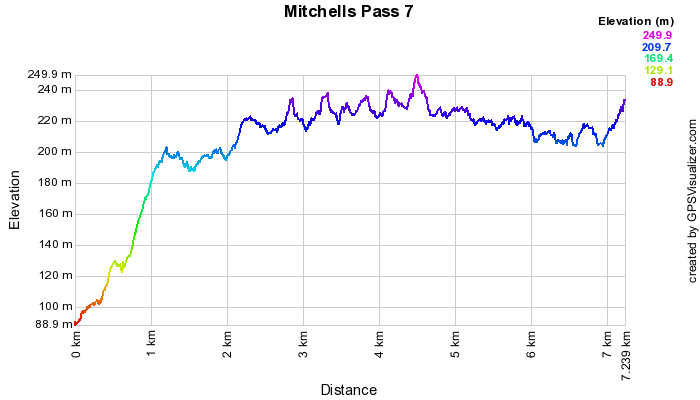
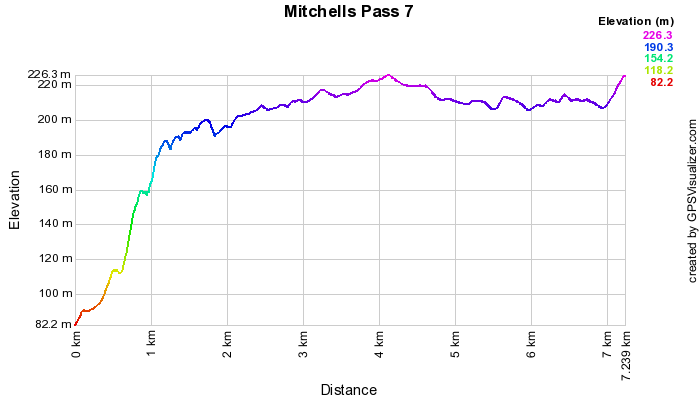
Here's another pair from a recent run (the first is Holux data and the second is DEM):
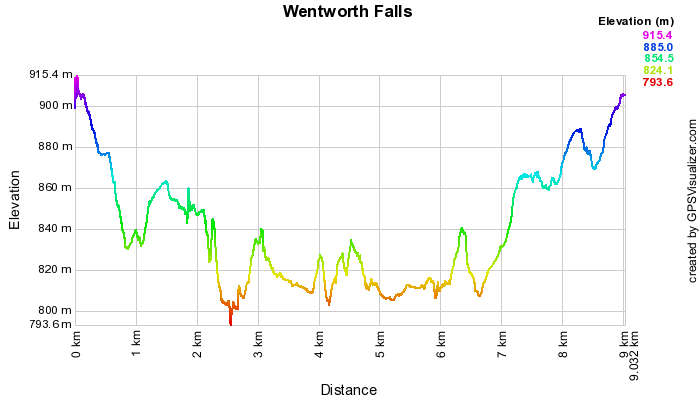
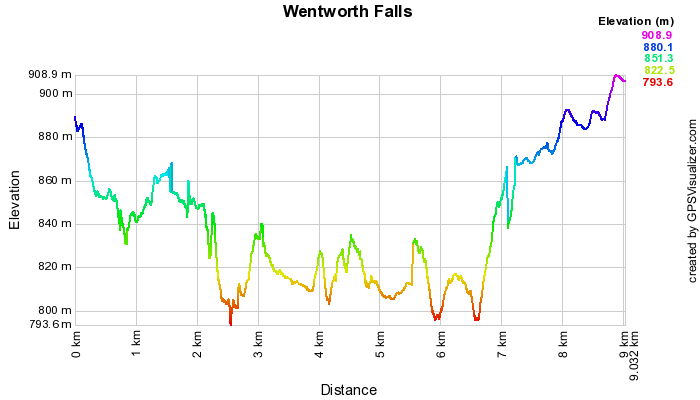
Now, I thought I'd apply it to the log I took on Saturday at Wentworth Falls. I'm not sure if this is necessarily wise because a lot of the time we were walking either just above or just under cliffs. A small inaccuracy laterally could mean a huge difference vertically (either down the cliff below or up the cliff above). There's no way for me to tell which of the two graphs is more accurate and I suspect some of the steep drops in the DEM version are lateral inaccuracies. I find it interesting how similar both profiles are between kilometres 2 and 5.
Again, the first is the Holux data and the second DEM.
I will probably do these conversions for most walks.


